
Knowledge base
3D Object Mapping using Force Sensor & Servo Cart (Python SDK)
This article contains code for mapping and visualizing an object from probing the target
PLEASE NOTE THIS CODE IS MEANT AS AN EXAMPLE/TEMPLATE AND SHOULD NOT BE RAN!!! USE THIS TO CREATE MODIFICATIONS TO ENSURE SAFETY AND COMPATABILITY WITH YOUR ROBOT
Requirements to run:
- Fairino robot (This code was written with an FR5; joint values and cartesian positions will vary with model)
- XJC Force/Torque sensor
- Any end of arm tool with precision end effector for accurate probing
- Python packages: numpy, matplotlib, time, Fairino SDK (available at Fairino Documentation Page)
The main code base below (Grid_test.py) is meant to accomplish the following:
- Given a starting joint position, size, and number of loops (number of probes per row and column) move to a hover point above an object (offsets determined by BASE COORDINATE SYSTEM)
- From the hover point, use servoCart() movements to slowly approach the target until a resistance force is met (controlled touch to the object)
- Record the point of detection and send that data to a .txt file
The grapher (joint_torque_grapher.py) is meant to accomplish the following:
- Read and parse values from the .txt files
- Display results as a 3D heatmap model to show rough shape of object probed (accuracy correlates with number of loops and size of map) shown below
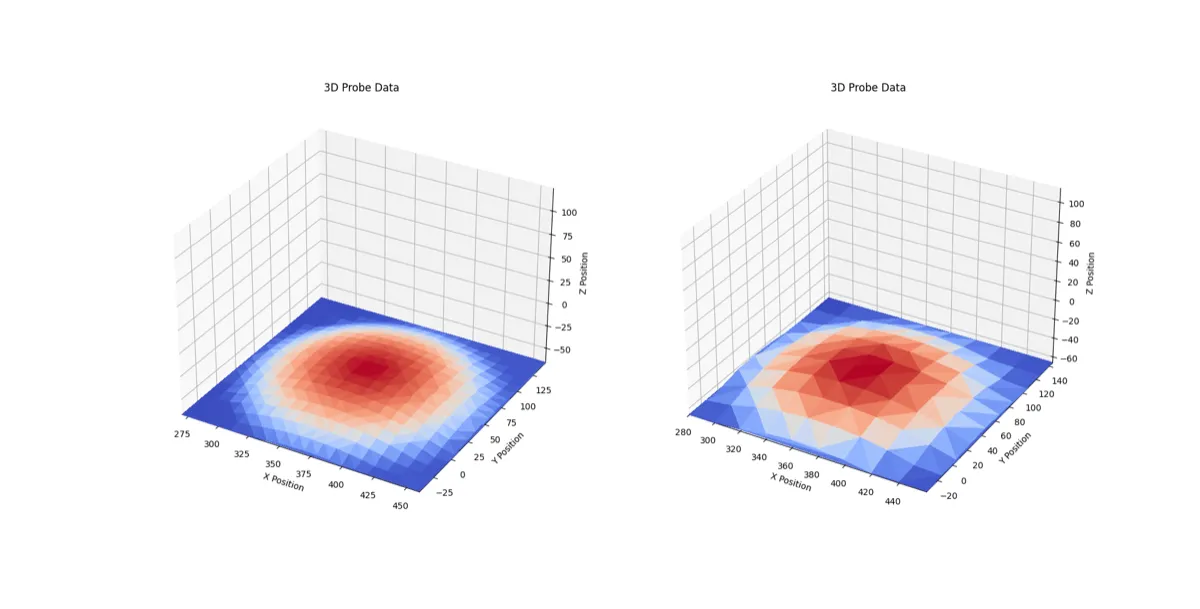
Source Code for main probing program (written for software version 3.8.2):
from fairino import Robot
import time
START_POS = [29.74836540222168, -134.0897674560547, -89.1602554321289, -46.7747802734375, 89.99434661865234, 29.713558197021484]
START_CART = [459.6044006347656, 145.47499084472656, -23.17245864868164, 179.98126220703125, -0.017205478623509407, -89.9651870727539]
length = 200 # Length/width of a square grid in mm
def get_z_force(robot: Robot.RPC):
 e, ft = robot.FT_GetForceTorqueRCS()
 if e != 0:
 print("Error getting force/torque:", e)
 return False
 return ft[2] # Z-axis force
def make_grid(robot: Robot.RPC, loops=20):
 file_object = open(f"{loops}x{loops}_data.txt", "w") # open graph data file
 robot.SetSpeed(40) # Set speed to 40%
 # Loop over specified grid size and probe for depth
 for i in range(loops):
 for j in range(loops):
 robot.MoveL(START_CART, tool=1, user=0, vel=100, offset_flag=1, offset_pos=[(i -(length / loops)), (j -(length / loops)), 0, 0, 0, 0]) # Go to probe prep
 time.sleep(0.5)
 # Use servo cart to slowly lower the tool until force is detected
 for _ in range(400):
 robot.ServoCart(1, [0, 0,-0.15, 0, 0, 0], vel=100)
 time.sleep(0.008)
 fz = get_z_force(robot)
 if( fz is not False):
 if(abs(fz) > 0.5):
 coord = robot.GetActualTCPPose()[1][:3] # Get current TCP position of contact point
 file_object.write(f"{[i for i in coord]} \n".replace('[', '').replace(']', '')) # Write to file
 print(f"Force detected: {fz} at position {coord}")
 break
 else:
 return False
 robot.MoveL(robot.GetActualTCPPose()[1], tool=1, user=0, vel=100, offset_flag=1, offset_pos=[0, 0, 50, 0, 0, 0]) # Retract 50mm
def main():
 robot = Robot.RPC('192.168.58.2')
 robot.SetSpeed(20) # Set speed to 20%
 robot.FT_SetZero(1) # Set force/torque sensor zero
 robot.MoveJ(START_POS, tool=0, user=0, vel=50) # Move to start position
 make_grid(robot, loops=10)
if name == "__main__":
 main()
Source code for object grapher (joint_torque_grapher.py):
import matplotlib.pyplot as plt
import numpy as np
data = np.loadtxt('10x10_data.txt', delimiter=',')
x = data[:, 0]
y = data[:, 1]
z = data[:, 2]
print(max(z) - min(z))
fig = plt.figure(figsize=(10, 8))
ax = plt.axes(122, projection='3d')
plt.xlim(min(x) - 100, max(x) + 100)
plt.ylim(min(y) - 100, max(y) + 100)
ax.set_xlabel('X Position')
ax.set_ylabel('Y Position')
ax.set_zlabel('Z Position')
ax_dims = max([max(x) - min(x), max(y) - min(y), max(z) - min(z)])
ax.set(zlim=(min(z), min(z) + ax_dims))
ax.set(xlim=(min(x), min(x) + ax_dims))
ax.set(ylim=(min(y), min(y) + ax_dims))
plt.title('3D Probe Data')
ax.plot_trisurf(x, y, z, linewidth=0.2, antialiased=False, cmap='coolwarm')
############################################
data = np.loadtxt('20x20_data.txt', delimiter=',')
x = data[:, 0]
y = data[:, 1]
z = data[:, 2]
ax2 = plt.axes(121, projection='3d')
plt.xlim(min(x) - 100, max(x) + 100)
plt.ylim(min(y) - 100, max(y) + 100)
ax2.set_xlabel('X Position')
ax2.set_ylabel('Y Position')
ax2.set_zlabel('Z Position')
ax_dims = max([max(x) - min(x), max(y) - min(y), max(z) - min(z)])
ax2.set(zlim=(min(z), min(z) + ax_dims))
ax2.set(xlim=(min(x), min(x) + ax_dims))
ax2.set(ylim=(min(y), min(y) + ax_dims))
plt.title('3D Probe Data')
ax2.plot_trisurf(x, y, z, linewidth=0.2, antialiased=False, cmap='coolwarm')
plt.show()
Translated from Fairino documentation. For anything safety-related, check against the equipment manual and with your advisor before moving the robot.
Still stuck?
Write to us with the serial number and what you already tried. Someone who has installed these units answers.
Request support →